Planning Debug Tools#
This package contains several planning-related debug tools.
- Trajectory analyzer: visualizes the information (speed, curvature, yaw, etc) along the trajectory
- Closest velocity checker: prints the velocity information indicated by each modules
- Perception reproducer: generates perception objects and reference images from rosbag data in planning simulator environment
- processing time checker: displays processing_time of modules on the terminal
- logging level updater: updates the logging level of the planning modules.
Trajectory analyzer#
The trajectory_analyzer visualizes the information (speed, curvature, yaw, etc) along the trajectory. This feature would be helpful for purposes such as "investigating the reason why the vehicle decelerates here". This feature employs the OSS PlotJuggler.
Stop reason visualizer#
This is to visualize stop factor and reason. see the details
How to use#
please launch the analyzer node
bash
ros2 launch planning_debug_tools trajectory_analyzer.launch.xml
and visualize the analyzed data on the plot juggler following below.
setup PlotJuggler#
For the first time, please add the following code to reactive script and save it as the picture below! (Looking for the way to automatically load the configuration file...)
You can customize what you plot by editing this code.
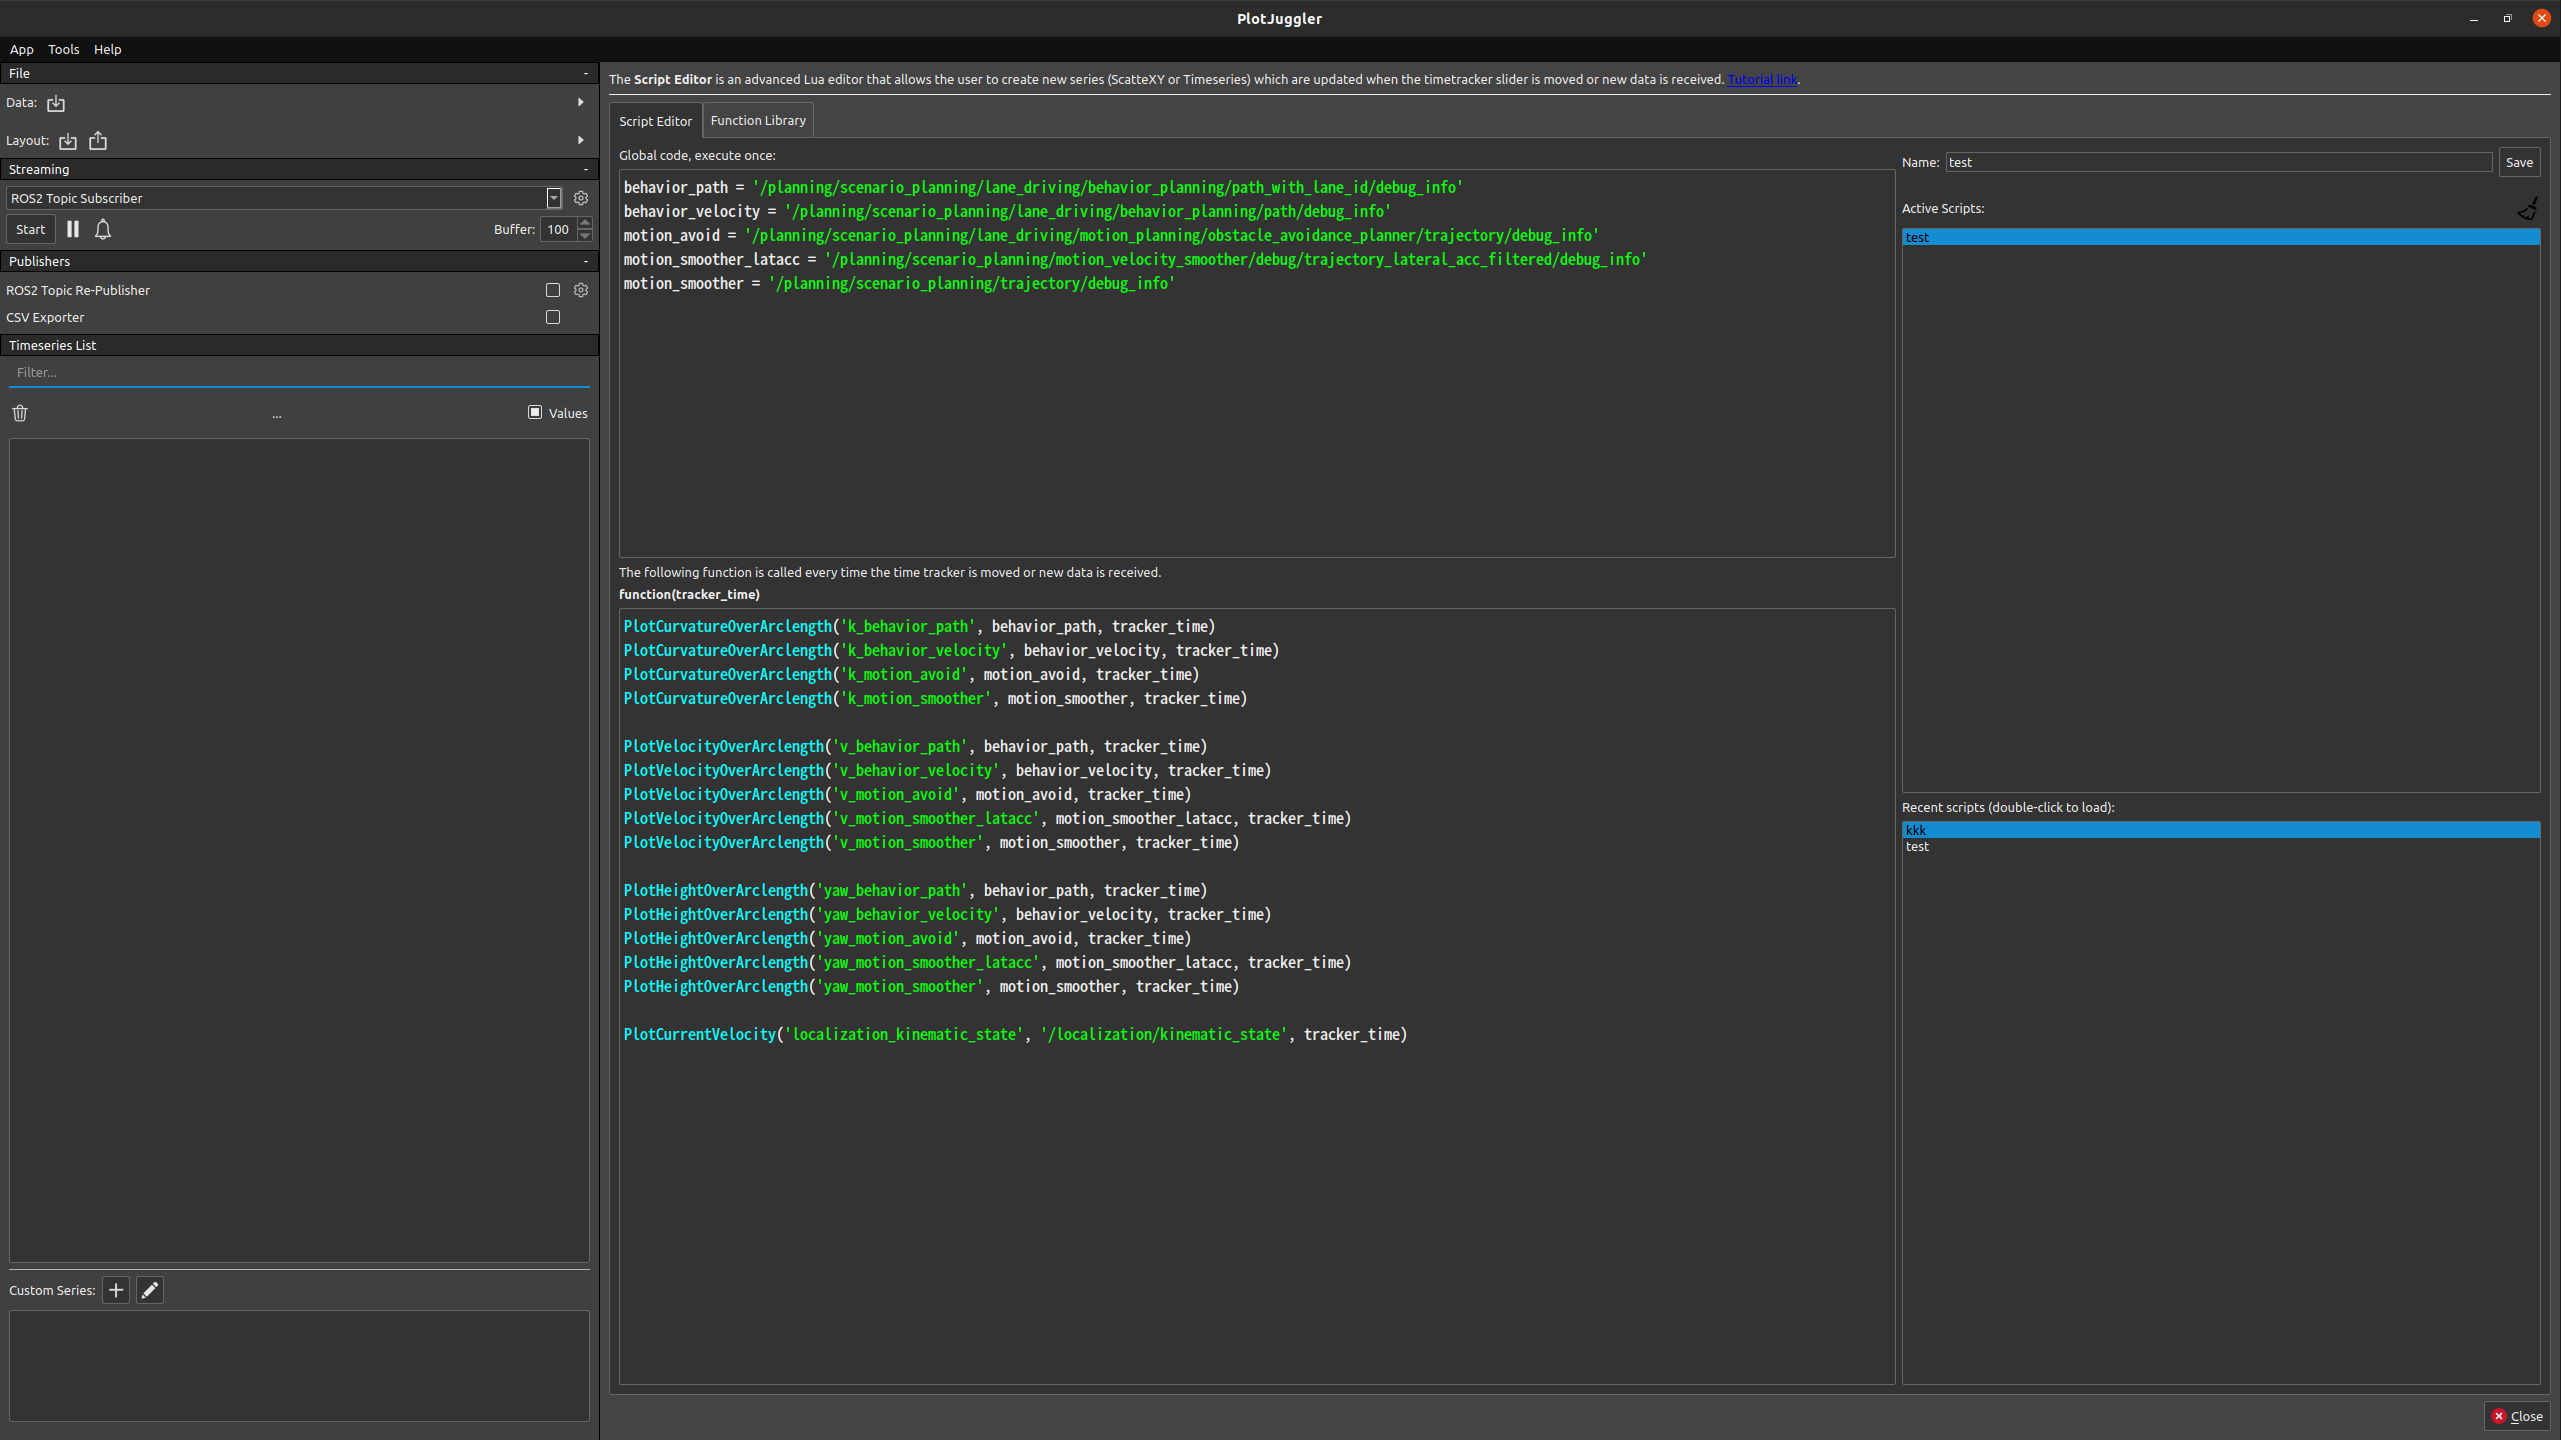
in Global code
lua
behavior_path = '/planning/scenario_planning/lane_driving/behavior_planning/path_with_lane_id/debug_info'
behavior_velocity = '/planning/scenario_planning/lane_driving/behavior_planning/path/debug_info'
motion_avoid = '/planning/scenario_planning/lane_driving/motion_planning/path_optimizer/trajectory/debug_info'
motion_smoother_latacc = '/planning/scenario_planning/motion_velocity_smoother/debug/trajectory_lateral_acc_filtered/debug_info'
motion_smoother = '/planning/trajectory/debug_info'
in function(tracker_time)
```lua PlotCurvatureOverArclength('k_behavior_path', behavior_path, tracker_time) PlotCurvatureOverArclength('k_behavior_velocity', behavior_velocity, tracker_time) PlotCurvatureOverArclength('k_motion_avoid', motion_avoid, tracker_time) PlotCurvatureOverArclength('k_motion_smoother', motion_smoother, tracker_time)
PlotVelocityOverArclength('v_behavior_path', behavior_path, tracker_time) PlotVelocityOverArclength('v_behavior_velocity', behavior_velocity, tracker_time) PlotVelocityOverArclength('v_motion_avoid', motion_avoid, tracker_time) PlotVelocityOverArclength('v_motion_smoother_latacc', motion_smoother_latacc, tracker_time) PlotVelocityOverArclength('v_motion_smoother', motion_smoother, tracker_time)
PlotAccelerationOverArclength('a_behavior_path', behavior_path, tracker_time) PlotAccelerationOverArclength('a_behavior_velocity', behavior_velocity, tracker_time) PlotAccelerationOverArclength('a_motion_avoid', motion_avoid, tracker_time) PlotAccelerationOverArclength('a_motion_smoother_latacc', motion_smoother_latacc, tracker_time) PlotAccelerationOverArclength('a_motion_smoother', motion_smoother, tracker_time)
PlotYawOverArclength('yaw_behavior_path', behavior_path, tracker_time) PlotYawOverArclength('yaw_behavior_velocity', behavior_velocity, tracker_time) PlotYawOverArclength('yaw_motion_avoid', motion_avoid, tracker_time) PlotYawOverArclength('yaw_motion_smoother_latacc', motion_smoother_latacc, tracker_time) PlotYawOverArclength('yaw_motion_smoother', motion_smoother, tracker_time)
PlotCurrentVelocity('localization_kinematic_state', '/localization/kinematic_state', tracker_time) ```
in Function Library
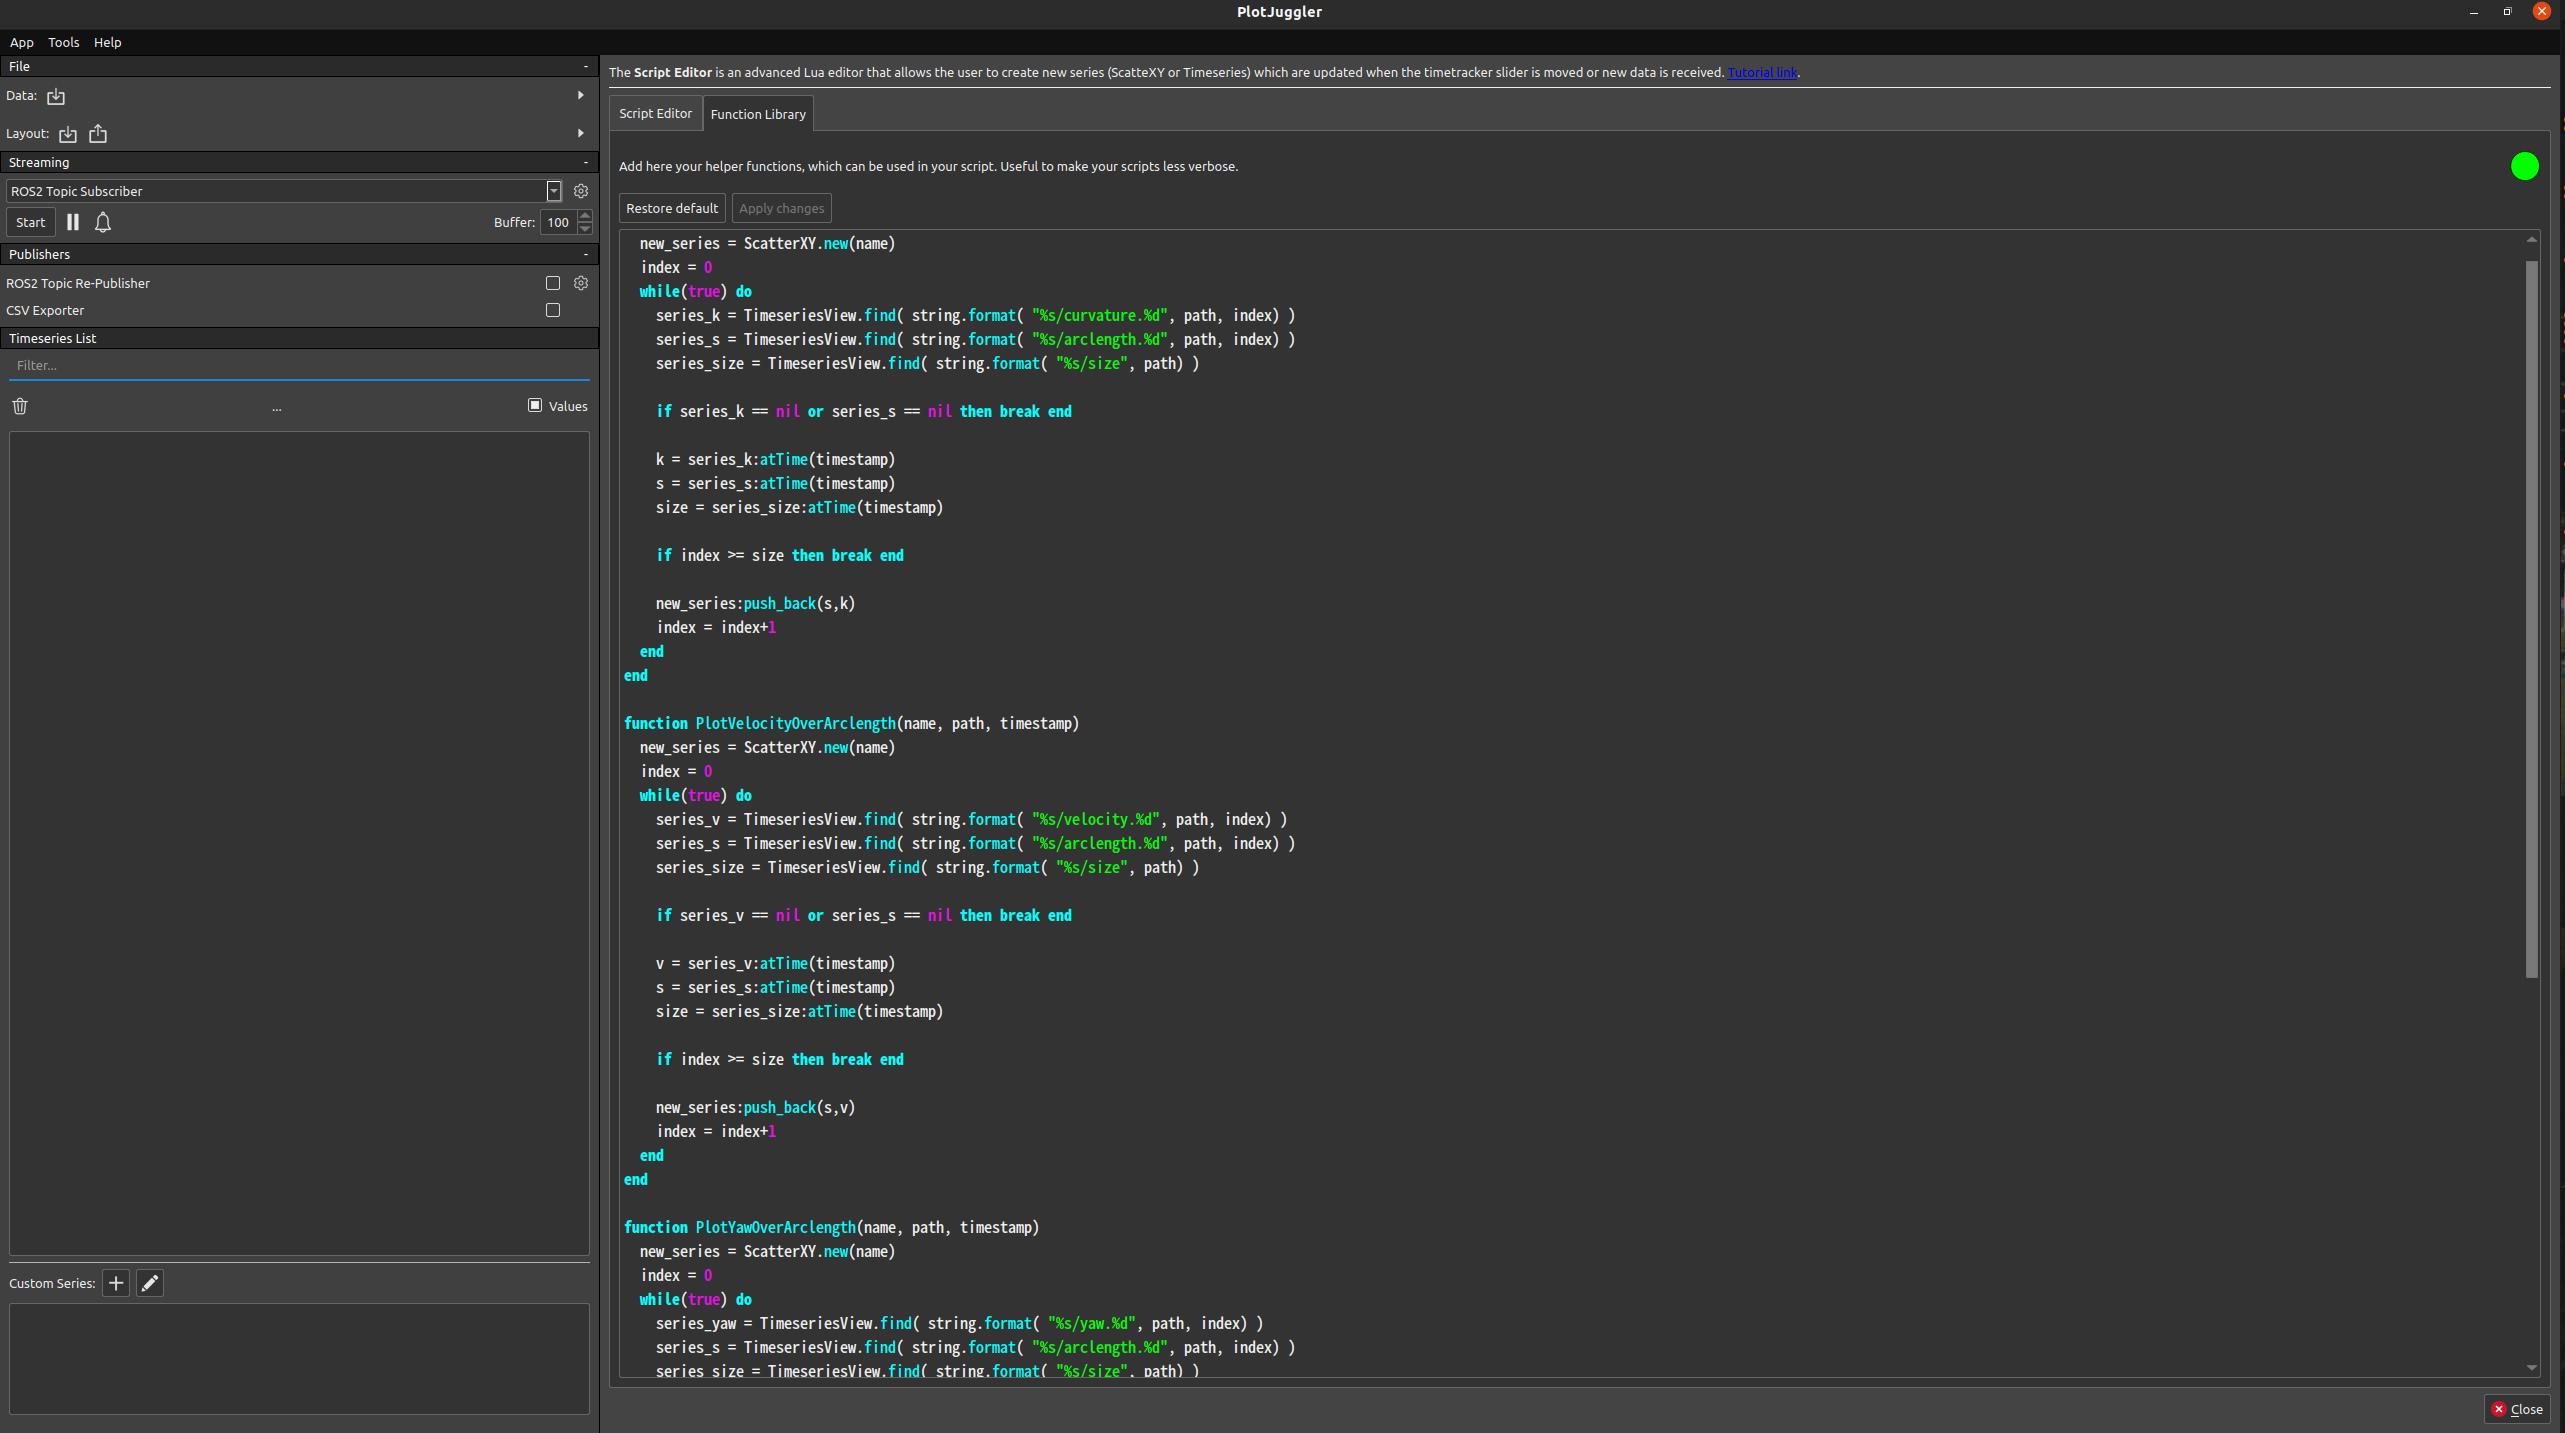
```lua
function PlotValue(name, path, timestamp, value) new_series = ScatterXY.new(name) index = 0 while(true) do series_k = TimeseriesView.find( string.format( "%s/"..value.."[%d]", path, index) ) series_s = TimeseriesView.find( string.format( "%s/arclength[%d]", path, index) ) series_size = TimeseriesView.find( string.format( "%s/size", path) )
if series_k == nil or series_s == nil then break end

k = series_k:atTime(timestamp)
s = series_s:atTime(timestamp)
size = series_size:atTime(timestamp)

if index >= size then break end

new_series:push_back(s,k)
index = index+1
end end
function PlotCurvatureOverArclength(name, path, timestamp) PlotValue(name, path, timestamp,"curvature") end
function PlotVelocityOverArclength(name, path, timestamp) PlotValue(name, path, timestamp,"velocity") end
function PlotAccelerationOverArclength(name, path, timestamp) PlotValue(name, path, timestamp,"acceleration") end
function PlotYawOverArclength(name, path, timestamp) PlotValue(name, path, timestamp,"yaw") end
function PlotCurrentVelocity(name, kinematics_name, timestamp) new_series = ScatterXY.new(name) series_v = TimeseriesView.find( string.format( "%s/twist/twist/linear/x", kinematics_name)) if series_v == nil then print("error") return end v = series_v:atTime(timestamp) new_series:push_back(0.0, v) end ```
Then, run the plot juggler.
How to customize the plot#
Add Path/PathWithLaneIds/Trajectory topics you want to plot in the trajectory_analyzer.launch.xml, then the analyzed topics for these messages will be published with TrajectoryDebugINfo.msg type. You can then visualize these data by editing the reactive script on the PlotJuggler.
Requirements#
The version of the plotJuggler must be > 3.5.0
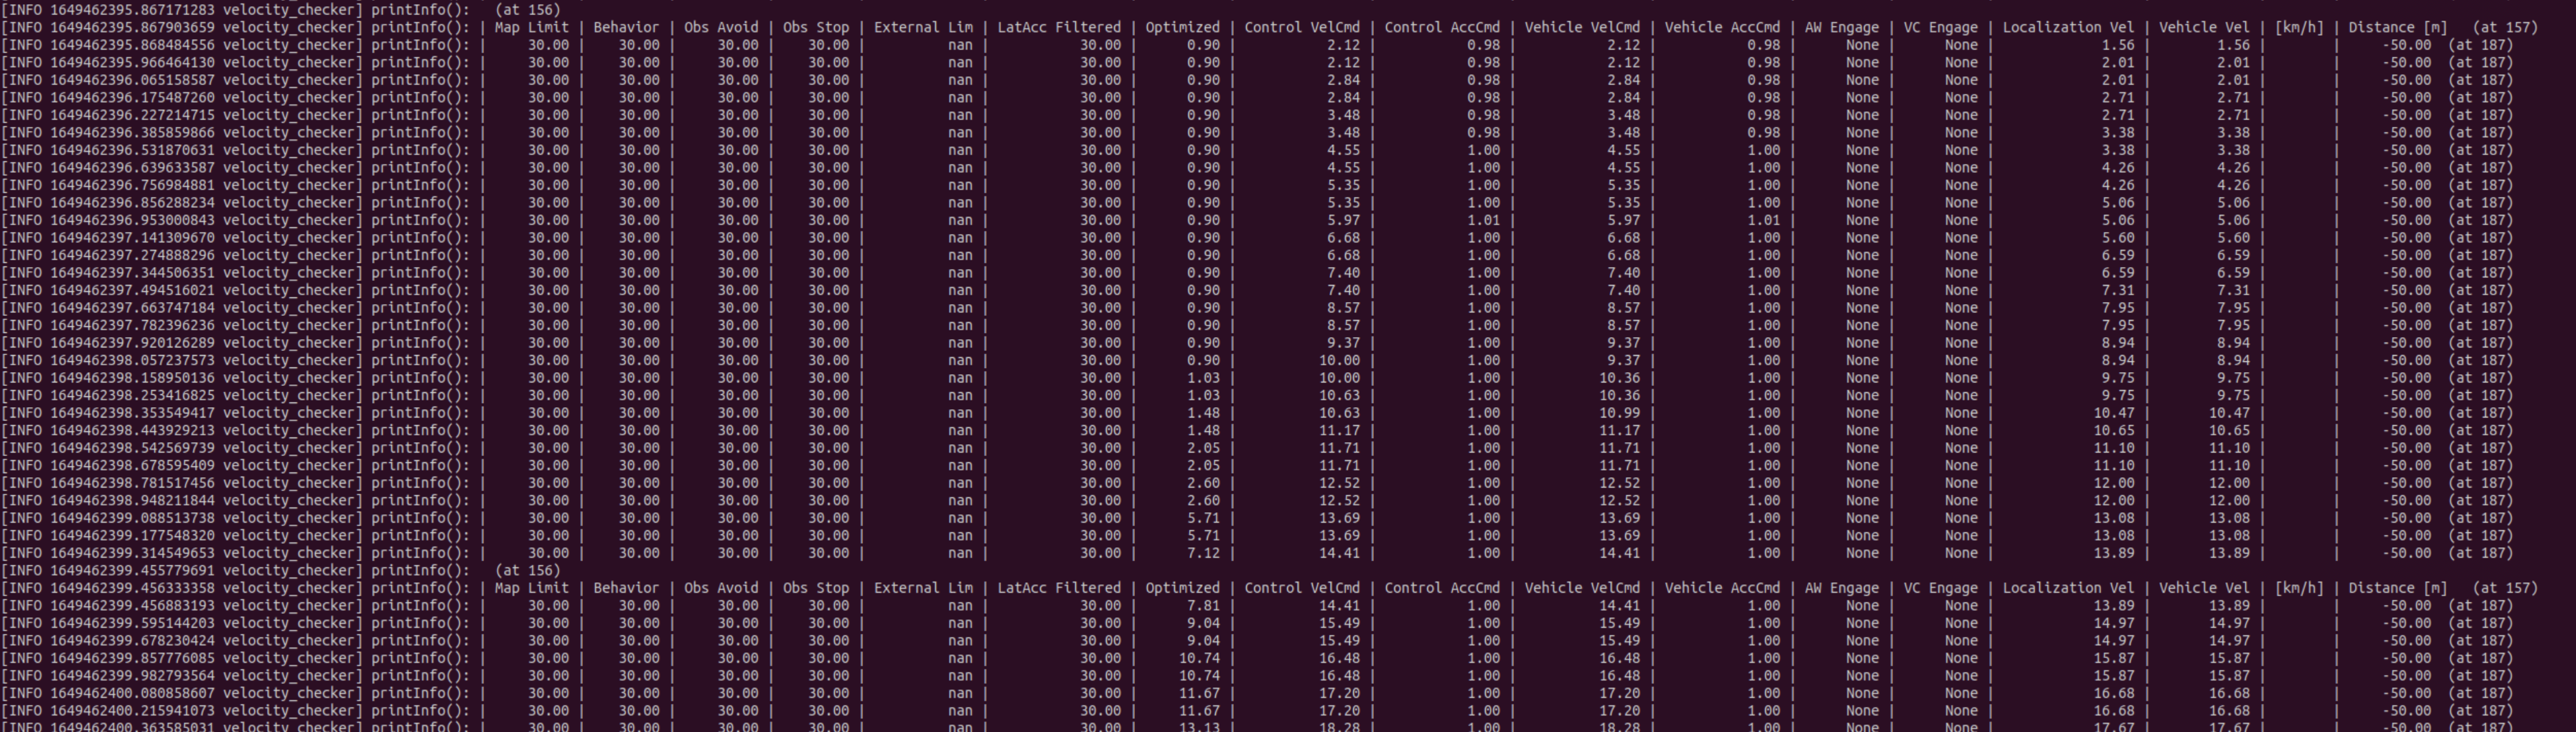
Closest velocity checker#
This node prints the velocity information indicated by planning/control modules on a terminal. For trajectories calculated by planning modules, the target velocity on the trajectory point which is closest to the ego vehicle is printed. For control commands calculated by control modules, the target velocity and acceleration is directly printed. This feature would be helpful for purposes such as "investigating the reason why the vehicle does not move".
You can launch by
bash
ros2 run planning_debug_tools closest_velocity_checker.py
Trajectory visualizer#
The old version of the trajectory analyzer. It is written in Python and more flexible, but very slow.
For other use case (experimental)#
To see behavior velocity planner's internal plath with lane id
add below example value to behavior velocity analyzer and set is_publish_debug_path: true
lua
crosswalk ='/planning/scenario_planning/lane_driving/behavior_planning/behavior_velocity_planner/debug/path_with_lane_id/crosswalk/debug_info'
intersection ='/planning/scenario_planning/lane_driving/behavior_planning/behavior_velocity_planner/debug/path_with_lane_id/intersection/debug_info'
traffic_light ='/planning/scenario_planning/lane_driving/behavior_planning/behavior_velocity_planner/debug/path_with_lane_id/traffic_light/debug_info'
merge_from_private ='/planning/scenario_planning/lane_driving/behavior_planning/behavior_velocity_planner/debug/path_with_lane_id/merge_from_private/debug_info'
occlusion_spot ='/planning/scenario_planning/lane_driving/behavior_planning/behavior_velocity_planner/debug/path_with_lane_id/occlusion_spot/debug_info'
```lua PlotVelocityOverArclength('v_crosswalk', crosswalk, tracker_time) PlotVelocityOverArclength('v_intersection', intersection, tracker_time) PlotVelocityOverArclength('v_merge_from_private', merge_from_private, tracker_time) PlotVelocityOverArclength('v_traffic_light', traffic_light, tracker_time) PlotVelocityOverArclength('v_occlusion', occlusion_spot, tracker_time)
PlotYawOverArclength('yaw_crosswalk', crosswalk, tracker_time) PlotYawOverArclength('yaw_intersection', intersection, tracker_time) PlotYawOverArclength('yaw_merge_from_private', merge_from_private, tracker_time) PlotYawOverArclength('yaw_traffic_light', traffic_light, tracker_time) PlotYawOverArclength('yaw_occlusion', occlusion_spot, tracker_time)
PlotCurrentVelocity('localization_kinematic_state', '/localization/kinematic_state', tracker_time) ```
Perception reproducer#
This script can overlay the perception results from the rosbag on the planning simulator synchronized with the simulator's ego pose.
Topics from Rosbag#
The following topics are loaded from the rosbag and replayed:
/localization/kinematic_state(nav_msgs/msg/Odometry): Ego vehicle odometry data/perception/object_recognition/tracking/objects(autoware_perception_msgs/msg/TrackedObjects): Tracked objects (when-toption is used)/perception/object_recognition/objects(autoware_perception_msgs/msg/PredictedObjects): Predicted objects (default)/perception/traffic_light_recognition/traffic_signals(autoware_perception_msgs/msg/TrafficLightGroupArray): Traffic light signals/perception/occupancy_grid_map/map(nav_msgs/msg/OccupancyGrid): Occupancy grid map (with transient_local QoS)/planning/mission_planning/route(autoware_planning_msgs/msg/LaneletRoute): Route data (with transient_local QoS, when--replay-routeoption is used)/planning/mission_planning/state(autoware_planning_msgs/msg/RouteState): Route state data (with transient_local QoS, when--replay-routeoption is used)<any CompressedImage topic>(sensor_msgs/msg/CompressedImage): Reference images for visualization (when--reference-image-topicsis used)
Published Topics#
The following topics are published during replay:
/perception/object_recognition/tracking/objectsor/perception/object_recognition/objects: Replayed perception objects/perception/traffic_light_recognition/traffic_signals: Replayed traffic light signals/perception/occupancy_grid_map/map: Replayed occupancy grid map (published with transient_local QoS, so late subscribers can receive the latest map)/planning/mission_planning/route: Replayed route (published with transient_local QoS, only when the message changes; when--replay-routeoption is used)/planning/mission_planning/state: Replayed route state (published with transient_local QoS, only when the message changes; when--replay-routeoption is used)<any CompressedImage topic>: Replayed reference images (published to the same topic name as in the rosbag)/perception_reproducer/rosbag_ego_odom: Debug topic for recorded ego odometry/initialpose: Initial pose (when-poption is used)/planning/mission_planning/goal: Goal pose (when-poption is used)
How it works#
The node subscribes to /localization/kinematic_state for the simulator ego pose and /initialpose3d to align the rosbag replay timeline when localization is reset (e.g. DLR DirectInitialPose).
Whenever the ego's position changes, a chronological reproduce_sequence queue is generated based on its position with a search radius (default to 2 m).
If the queue is empty, the nearest odom message in the rosbag is added to the queue.
When publishing perception messages, the first element in the reproduce_sequence is popped and published.
This design results in the following behavior:
- When ego stops, the perception messages are published in chronological order until queue is empty.
- When the ego moves, a perception message close to ego's position is published.
Available Options#
-b,--bag: Rosbag file path (required)-t,--tracked-object: Publish tracked objects instead of predicted objects-r,--search-radius: Set the search radius in meters (default: 1.5m). If set to 0, always publishes the nearest message-c,--reproduce-cool-down: Set the cool down time in seconds (default: 80.0s)-p,--pub-route: Initialize localization and publish a route based on poses from the rosbag--replay-route: Replay route and route state topics from rosbag data with transient_local QoS (only publishes when the message changes)-n,--noise: Apply perception noise to objects when publishing repeated messages (default: False)-f,--rosbag-format: Specify rosbag data format (default: "db3")--reference-image-topics: Comma-separated list of CompressedImage topics to load and publish (e.g.,"/sensing/camera/camera0/image_raw/compressed,/sensing/camera/camera1/image_raw/compressed")-v,--verbose: Output debug data-h,--help: Show help message
How to use#
First, launch the planning simulator, and put the ego pose. Then, run the script according to the following command.
By designating a rosbag, perception reproducer can be launched.
bash
ros2 run planning_debug_tools perception_reproducer -b <bag-file>
You can designate multiple rosbags in the directory.
bash
ros2 run planning_debug_tools perception_reproducer -b <dir-to-bag-files>
Instead of publishing predicted objects, you can publish tracked objects by designating -t.
The --pub-route option enables automatic route generation based on the rosbag data. When enabled, the script:
- Extracts the initial and goal poses from the beginning and end of the rosbag file
- Initializes the localization system with the initial pose
- Generates and publishes a route to the goal pose
Example usage with route publication:
bash
ros2 run planning_debug_tools perception_reproducer -b <bag-file> -p
The --replay-route option enables replaying of route and route state topics directly from the rosbag data. These topics use transient_local QoS and are only published when the message content changes (avoiding redundant publishes). This is useful when you want to replay the exact route that was recorded in the rosbag.
Example usage with route replaying:
bash
ros2 run planning_debug_tools perception_reproducer -b <bag-file> --replay-route
Perception replayer#
A part of the feature is under development.
This script can overlay the perception results from the rosbag on the planning simulator.
In detail, this script publishes the data at a certain timestamp from the rosbag. The timestamp will increase according to the real time without any operation. By using the GUI, you can modify the timestamp by pausing, changing the rate or going back into the past.
Topics from Rosbag#
The following topics are loaded from the rosbag and replayed:
/localization/kinematic_state(nav_msgs/msg/Odometry): Ego vehicle odometry data/perception/object_recognition/tracking/objects(autoware_perception_msgs/msg/TrackedObjects): Tracked objects (when-toption is used)/perception/object_recognition/objects(autoware_perception_msgs/msg/PredictedObjects): Predicted objects (default)/perception/traffic_light_recognition/traffic_signals(autoware_perception_msgs/msg/TrafficLightGroupArray): Traffic light signals/perception/occupancy_grid_map/map(nav_msgs/msg/OccupancyGrid): Occupancy grid map (with transient_local QoS)/planning/mission_planning/route(autoware_planning_msgs/msg/LaneletRoute): Route data (with transient_local QoS, when--replay-routeoption is used)/planning/mission_planning/state(autoware_planning_msgs/msg/RouteState): Route state data (with transient_local QoS, when--replay-routeoption is used)<any CompressedImage topic>(sensor_msgs/msg/CompressedImage): Reference images for visualization
Published Topics#
The following topics are published during replay:
/perception/object_recognition/tracking/objectsor/perception/object_recognition/objects: Replayed perception objects/perception/traffic_light_recognition/traffic_signals: Replayed traffic light signals/perception/occupancy_grid_map/map: Replayed occupancy grid map (published with transient_local QoS, so late subscribers can receive the latest map)/planning/mission_planning/route: Replayed route (published with transient_local QoS, only when the message changes; when--replay-routeoption is used)/planning/mission_planning/state: Replayed route state (published with transient_local QoS, only when the message changes; when--replay-routeoption is used)<any CompressedImage topic>: Replayed reference images/perception_reproducer/rosbag_ego_odom: Debug topic for recorded ego odometry
Available Options#
-b,--bag: Rosbag file path (required)-t,--tracked-object: Publish tracked objects--replay-route: Replay route and route state topics from rosbag data with transient_local QoS (only publishes when the message changes)-f,--rosbag-format: Specify rosbag data format (default: "db3")-v,--verbose: Output debug data-h,--help: Show help message
How to use#
First, launch the planning simulator, and put the ego pose. Then, run the script according to the following command.
By designating a rosbag, perception replayer can be launched. The GUI is launched as well with which a timestamp of rosbag can be managed.
bash
ros2 run planning_debug_tools perception_replayer -b <bag-file>
You can designate multiple rosbags in the directory.
bash
ros2 run planning_debug_tools perception_replayer -b <dir-to-bag-files>
Instead of publishing predicted objects, you can publish tracked objects by designating -t.
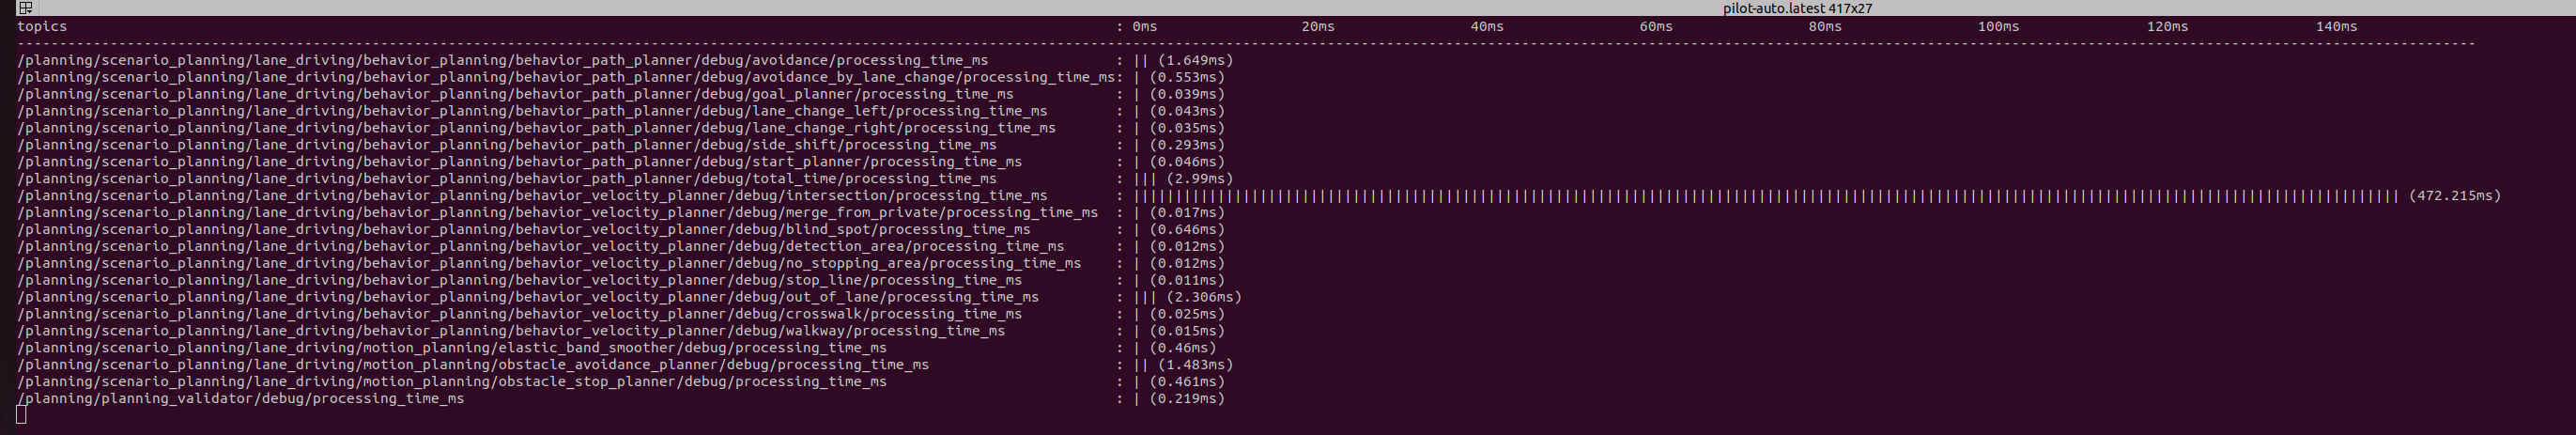
Processing time checker#
The purpose of the Processing Time Subscriber is to monitor and visualize the processing times of various ROS 2 topics in a system. By providing a real-time terminal-based visualization, users can easily confirm the processing time performance as in the picture below.
You can run the program by the following command.
bash
ros2 run planning_debug_tools processing_time_checker.py -f <update-hz> -m <max-bar-time>
This program subscribes to ROS 2 topics that have a suffix of processing_time_ms.
The program allows users to customize two parameters via command-line arguments:
- --max_display_time (or -m): This sets the maximum display time in milliseconds. The default value is 150ms.
- --display_frequency (or -f): This sets the frequency at which the terminal UI updates. The default value is 5Hz.
By adjusting these parameters, users can tailor the display to their specific monitoring needs.
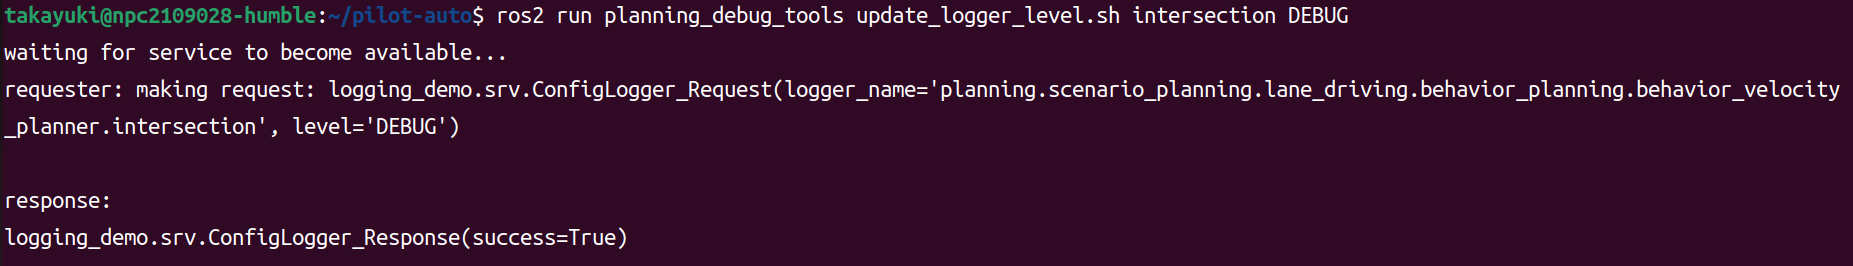
Logging Level Updater#
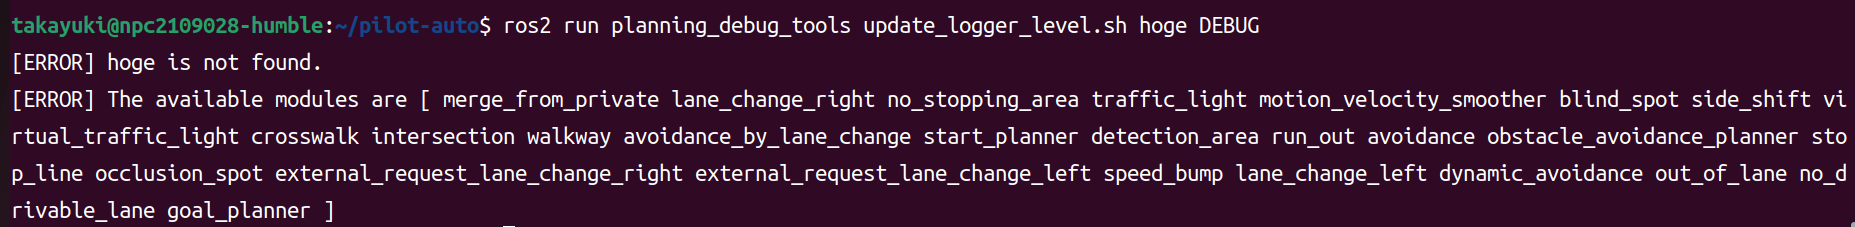
The purpose of the Logging Level Updater is to update the logging level of the planning modules via ROS 2 service. Users can easily update the logging level for debugging.
bash
ros2 run planning_debug_tools update_logger_level.sh <module-name> <logger-level>
<logger-level> will be DEBUG, INFO, WARN, or ERROR.
When you have a typo of the planning module, the script will show the available modules.