Debug#
Debug visualization#
The visualization markers of the planning flow (Input, Model Predictive Trajectory, and Output) are explained here.
All the following markers can be visualized by
bash
ros2 launch autoware_path_optimizer launch_visualiation.launch.xml vehilce_model:=sample_vehicle
The vehicle_model must be specified to make footprints with vehicle's size.
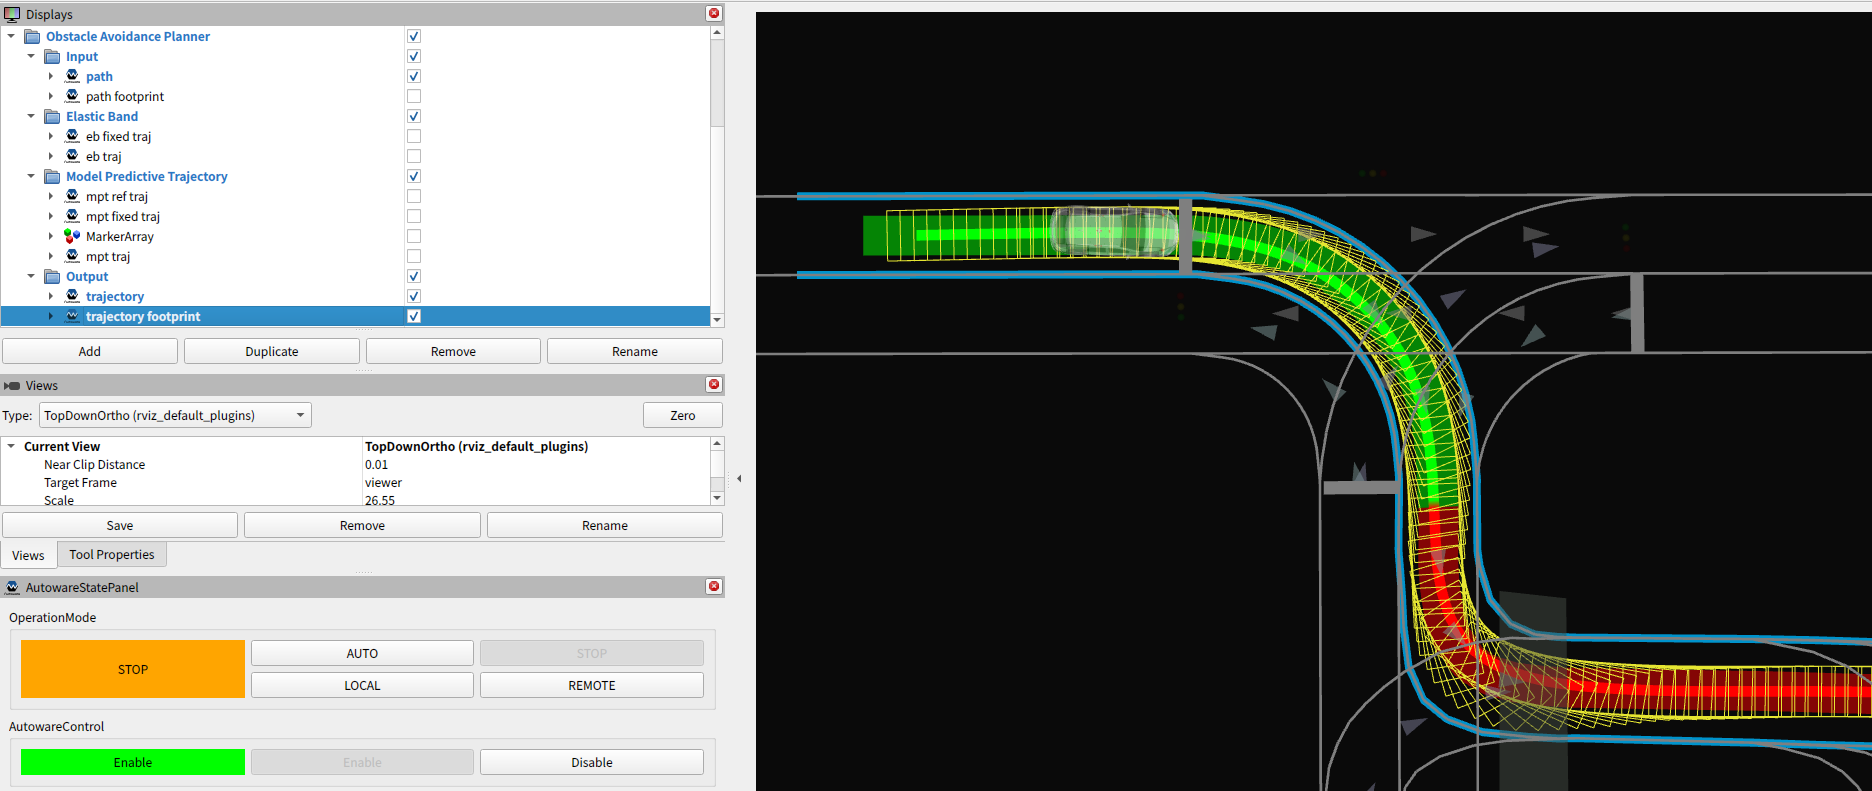
Input#
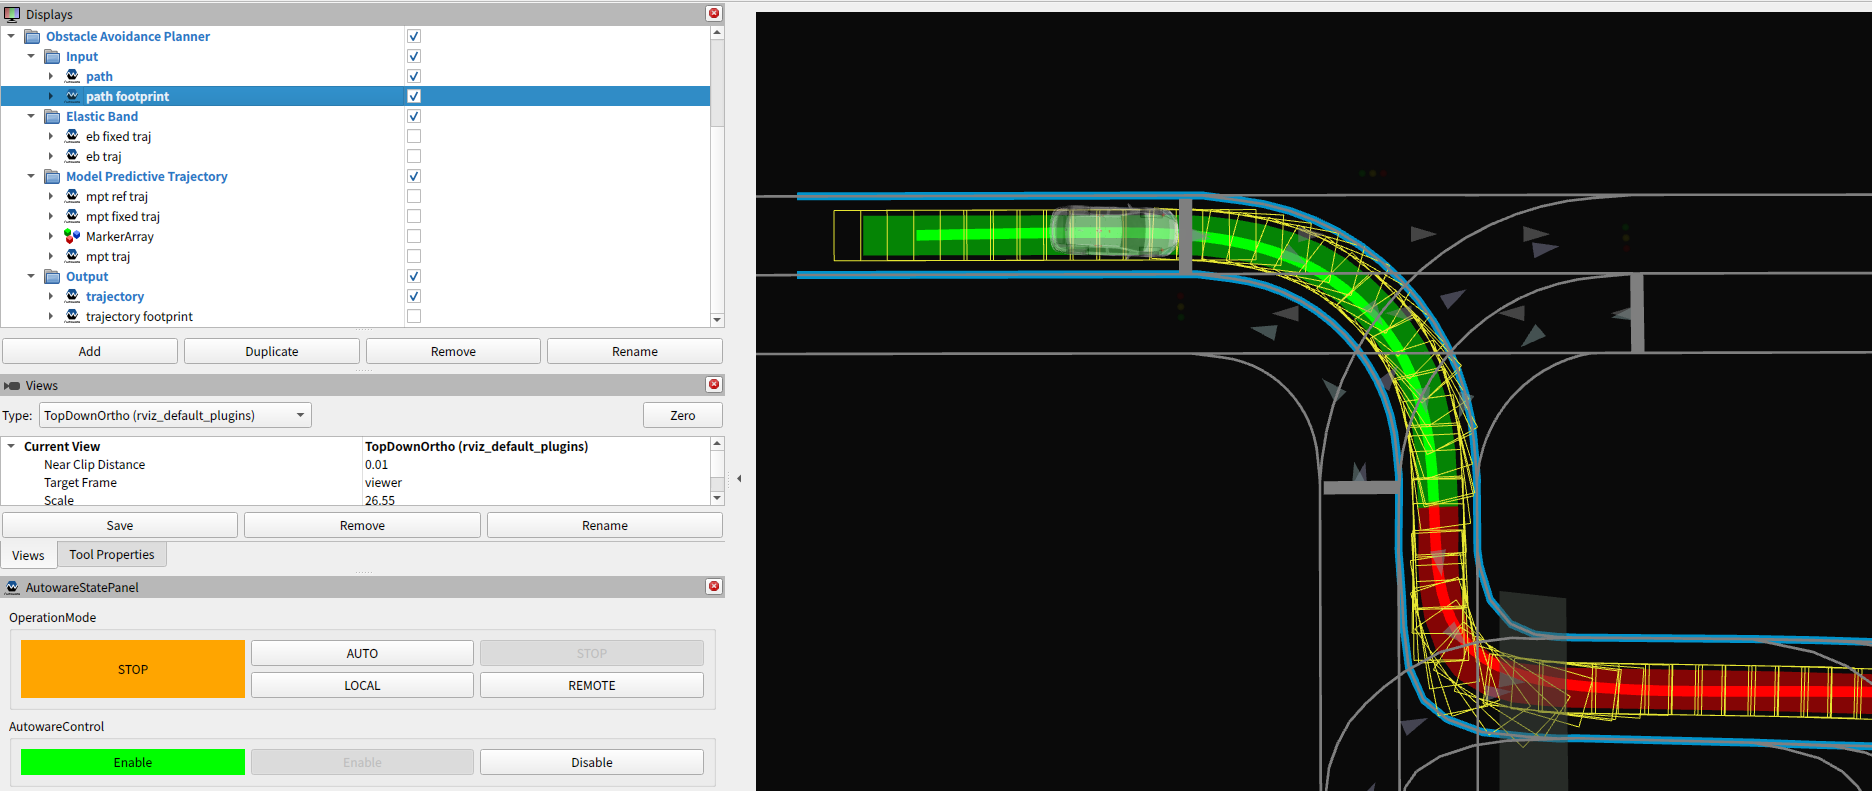
- Path
- The path generated in the
behaviorplanner. - The semitransparent and thick, green and red band, that is visualized by default.
- The path generated in the

- Path Footprint
- The path generated in the
behaviorplanner is converted to footprints. - NOTE:
- Check if there is no high curvature.
- The path may be outside the drivable area in some cases, but it is okay to ignore it since the
behaviorplanner does not support it.
- The path generated in the
- Drivable Area
- The Drivable area generated in the
behaviorplanner. - The skyblue left and right line strings, that is visualized by default.
- NOTE:
- Check if the path is almost inside the drivable area.
- Then, the
path_optimizerwill try to make the trajectory fully inside the drivable area.
- Then, the
- During avoidance or lane change by the
behaviorplanner, please make sure that the drivable area is expanded correctly.
- Check if the path is almost inside the drivable area.
- The Drivable area generated in the
Model Predictive Trajectory (MPT)#
- MPT Reference Trajectory
- The reference trajectory points of model predictive trajectory.

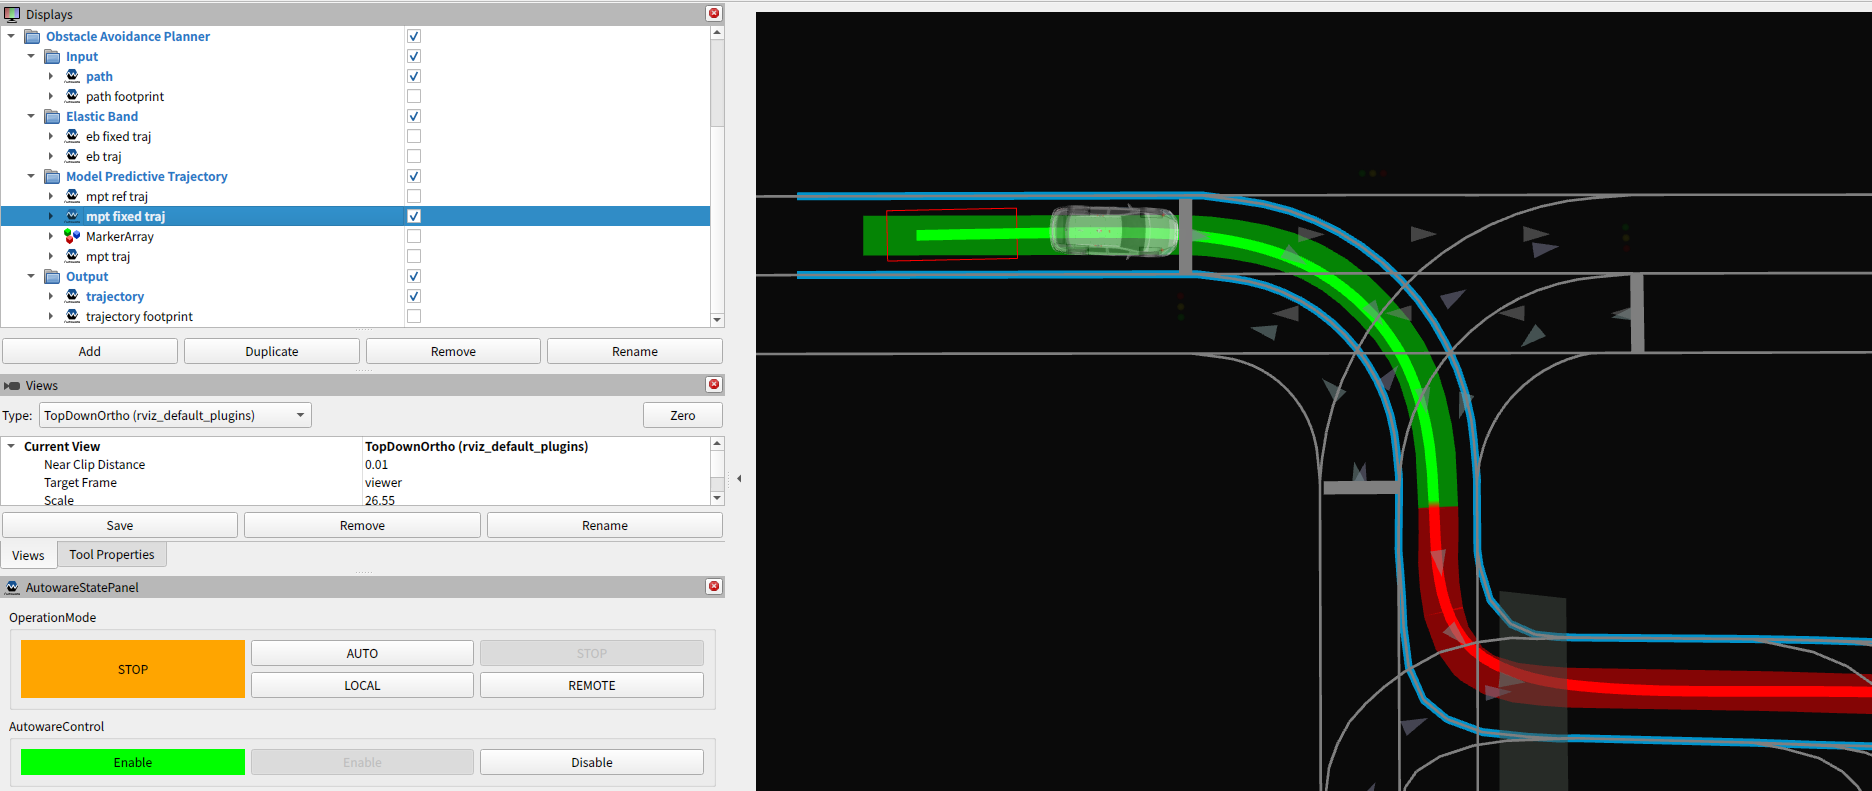
- MPT Fixed Trajectory
- The fixed trajectory points as a constraint of model predictive trajectory.
- Boundaries' Width
- The boundaries' width is calculated from the drivable area line strings.
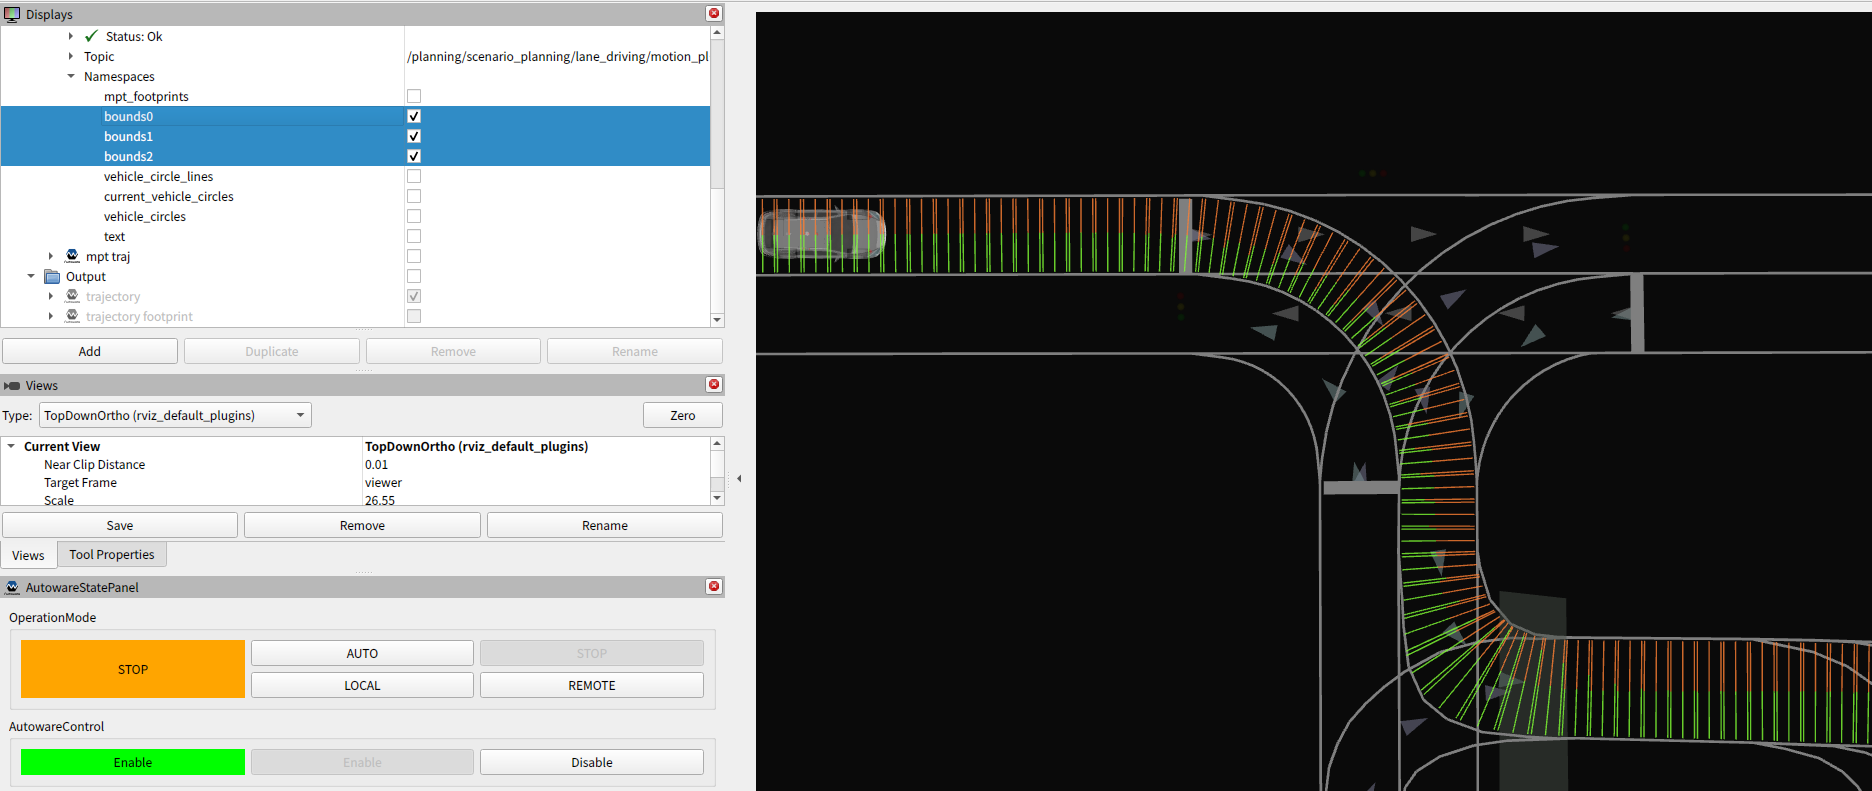
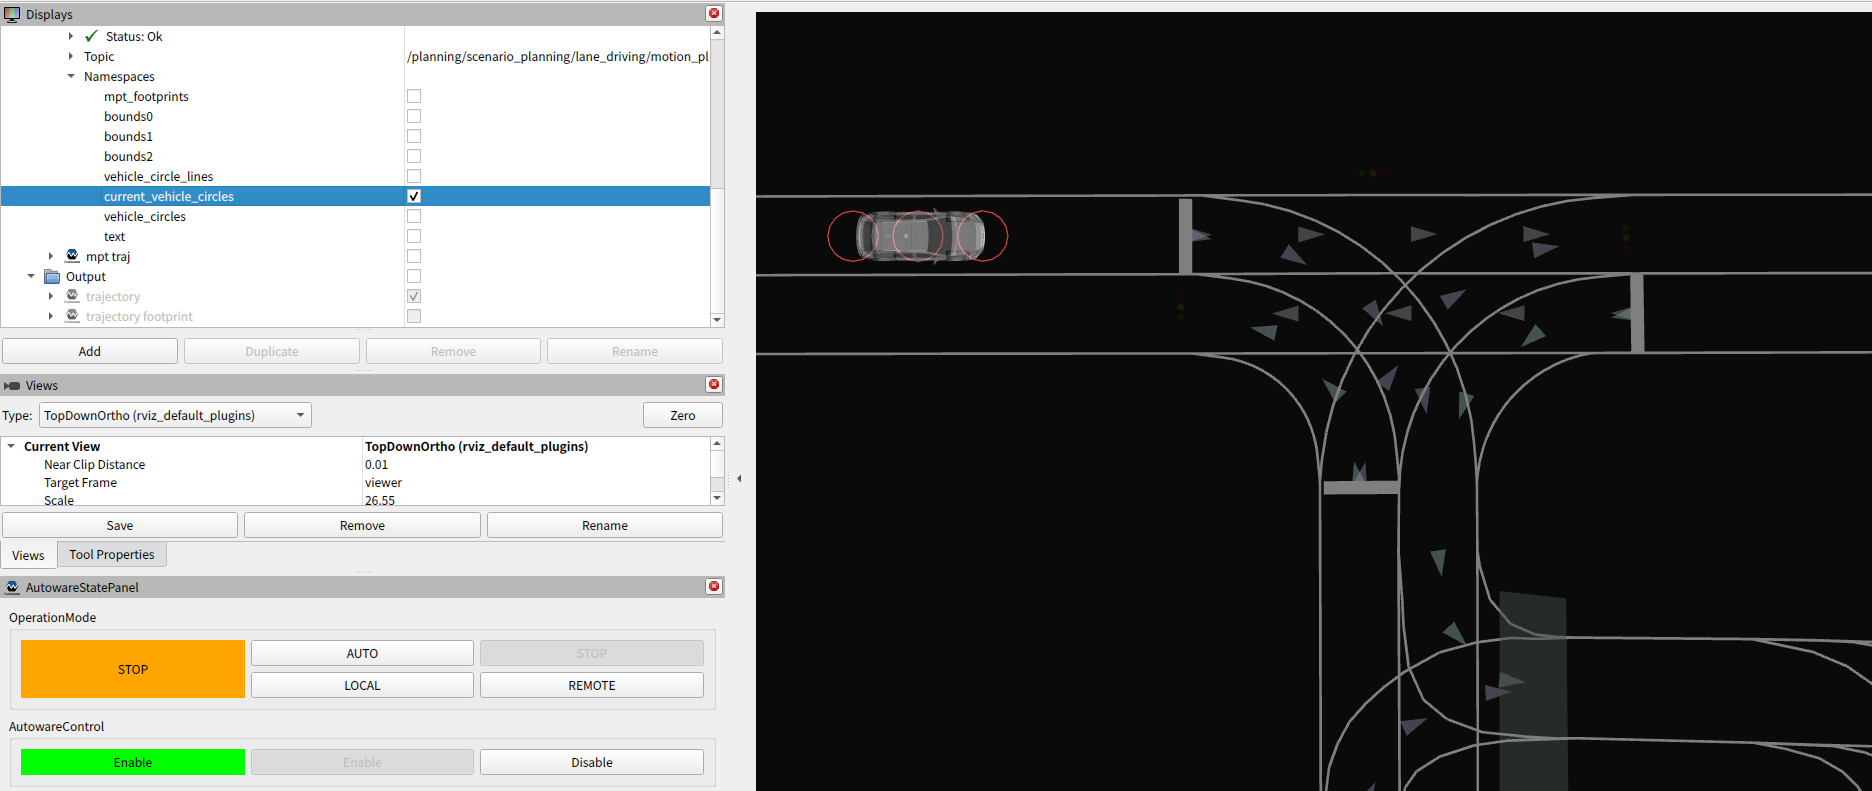
- Vehicle Circles
- The vehicle's shape is represented by a set of circles.
- The
path_optimizerwill try to make the these circles inside the above boundaries' width.
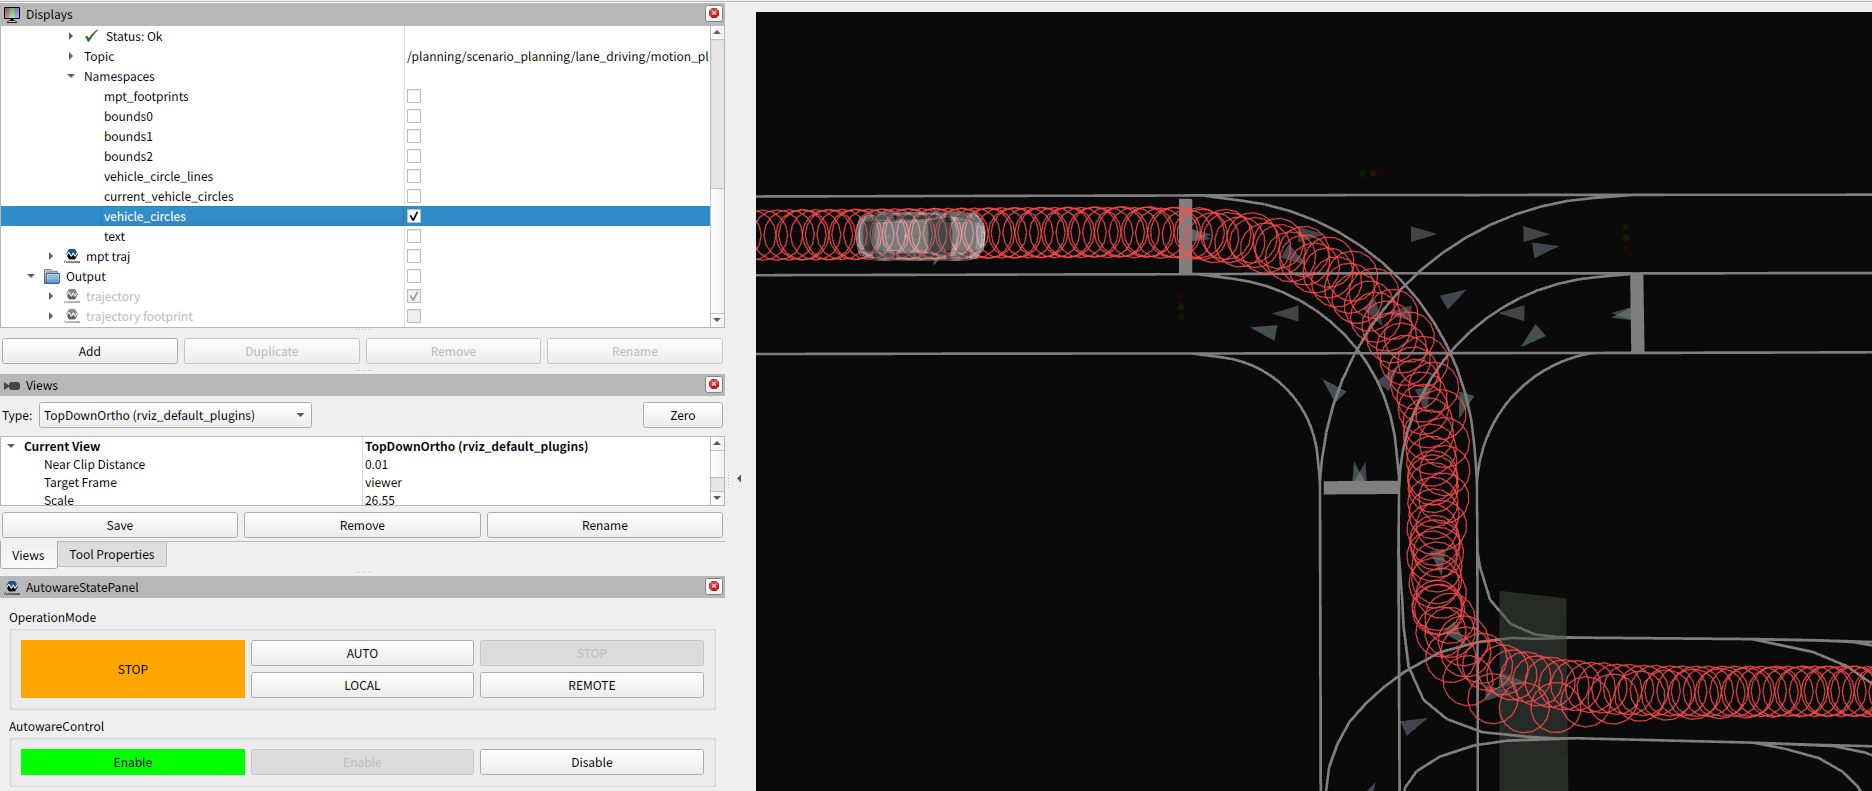
- Vehicle Circles on Trajectory
- The vehicle's circles on the MPT trajectory.
- Check if the circles are not so big compared to the road's width.
- MPT Trajectory
- The optimized trajectory points by model predictive trajectory.
- The footprints are supposed to be fully inside the drivable area.

Output#
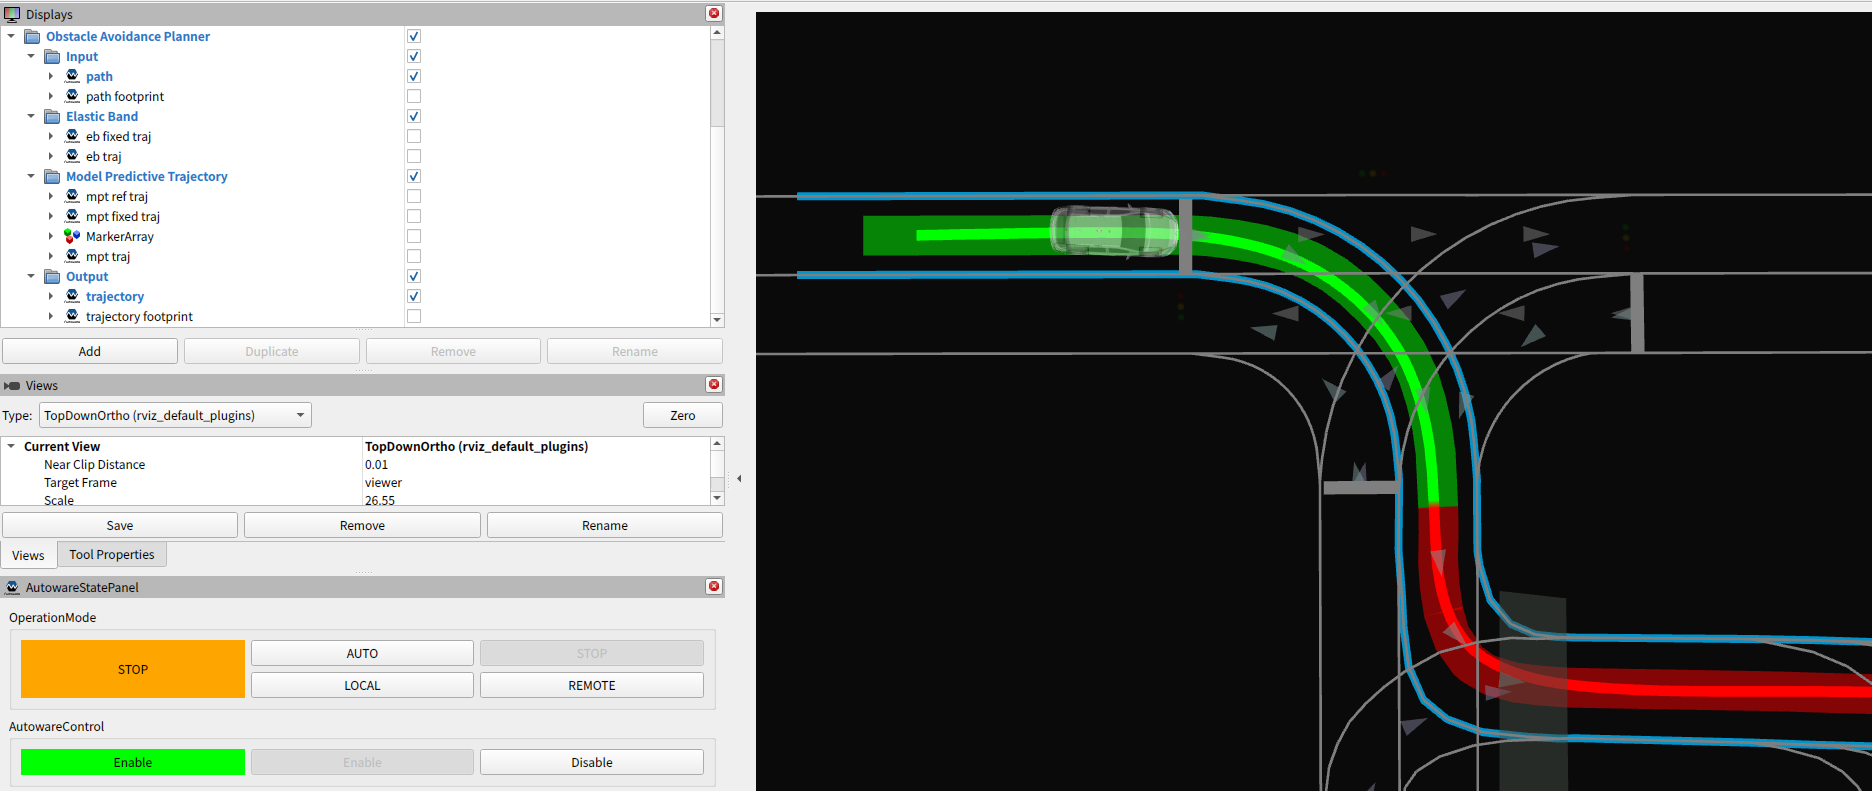
- Trajectory
- The output trajectory.
- The dark and thin, green and red band, that is visualized by default.

- Trajectory Footprint
- The output trajectory is converted to footprints.
Calculation time#
The path_optimizer consists of many functions such as boundaries' width calculation, collision-free planning, etc.
We can see the calculation time for each function as follows.
Raw data#
Enable option.enable_calculation_time_info or echo the topic as follows.
```sh $ ros2 topic echo /planning/scenario_planning/lane_driving/motion_planning/path_optimizer/debug/calculation_time --field data
    insertFixedPoint:= 0.008 [ms]
    getPaddedTrajectoryPoints:= 0.002 [ms]
    updateConstraint:= 0.741 [ms]
    optimizeTrajectory:= 0.101 [ms]
    convertOptimizedPointsToTrajectory:= 0.014 [ms]
  getEBTrajectory:= 0.991 [ms]
      resampleReferencePoints:= 0.058 [ms]
      updateFixedPoint:= 0.237 [ms]
      updateBounds:= 0.22 [ms]
      updateVehicleBounds:= 0.509 [ms]
    calcReferencePoints:= 1.649 [ms]
    calcMatrix:= 0.209 [ms]
    calcValueMatrix:= 0.015 [ms]
      calcObjectiveMatrix:= 0.305 [ms]
      calcConstraintMatrix:= 0.641 [ms]
      initOsqp:= 6.896 [ms]
      solveOsqp:= 2.796 [ms]
    calcOptimizedSteerAngles:= 9.856 [ms]
    calcMPTPoints:= 0.04 [ms]
  getModelPredictiveTrajectory:= 12.782 [ms]
optimizeTrajectory:= 12.981 [ms]
applyInputVelocity:= 0.577 [ms]
insertZeroVelocityOutsideDrivableArea:= 0.81 [ms]
  getDebugMarker:= 0.684 [ms]
  publishDebugMarker:= 4.354 [ms]
publishDebugMarkerOfOptimization:= 5.047 [ms]
generateOptimizedTrajectory:= 20.374 [ms] extendTrajectory:= 0.326 [ms] publishDebugData:= 0.008 [ms] onPath:= 20.737 [ms] ```
Plot#
With the following script, any calculation time of the above functions can be plot.
sh
ros2 run autoware_path_optimizer calculation_time_plotter.py
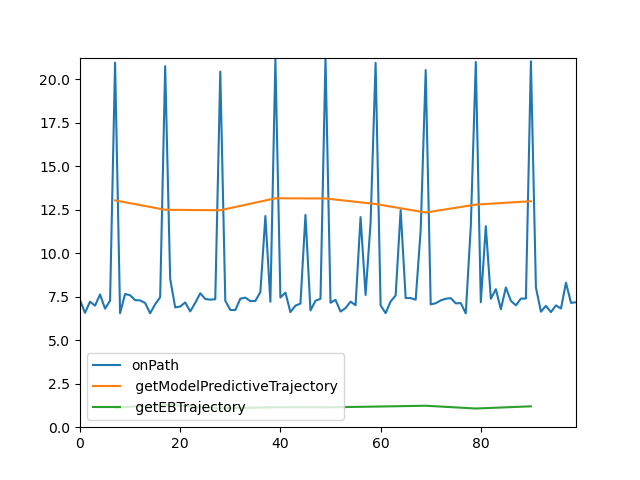
You can specify functions to plot with the -f option.
sh
ros2 run autoware_path_optimizer calculation_time_plotter.py -f "onPath, generateOptimizedTrajectory, calcReferencePoints"
Q&A for Debug#
The output frequency is low#
Check the function which is comparatively heavy according to this information.
For your information, the following functions for optimization and its initialization may be heavy in some complicated cases.
- MPT
initOsqpsolveOsqp
When a part of the trajectory has high curvature#
Some of the following may have an issue. Please check if there is something weird by the visualization.
- Input Path
- Drivable Area
- Boundaries' Width
When the trajectory's shape is zigzag#
Some of the following may have an issue. Please check if there is something weird by the visualization.
- Vehicle Circles on Trajectory