Evaluating the controller performance#
This page shows how to use control_performance_analysis package to evaluate the controllers.
control_performance_analysis is the package to analyze the tracking performance of a control module
and monitor the driving status of the vehicle.
If you need more detailed information about package, refer to the control_performance_analysis.
How to use#
Before Driving#
1. Firstly you need to launch Autoware. You can also use this tool with real vehicle driving#
2. Initialize the vehicle and send goal position to create route#
- If you have any problem with launching Autoware, please see the tutorials page.
3. Launch the control_performance_analysis package#
ros2 launch control_performance_analysis control_performance_analysis.launch.xml
- After this command, you should be able to see the driving monitor and error variables in topics.
4. Run the PlotJuggler in sourced terminal#
source ~/autoware/install/setup.bash
ros2 run plotjuggler plotjuggler
- If you do not have PlotJuggler in your computer, please refer here for installation guideline.
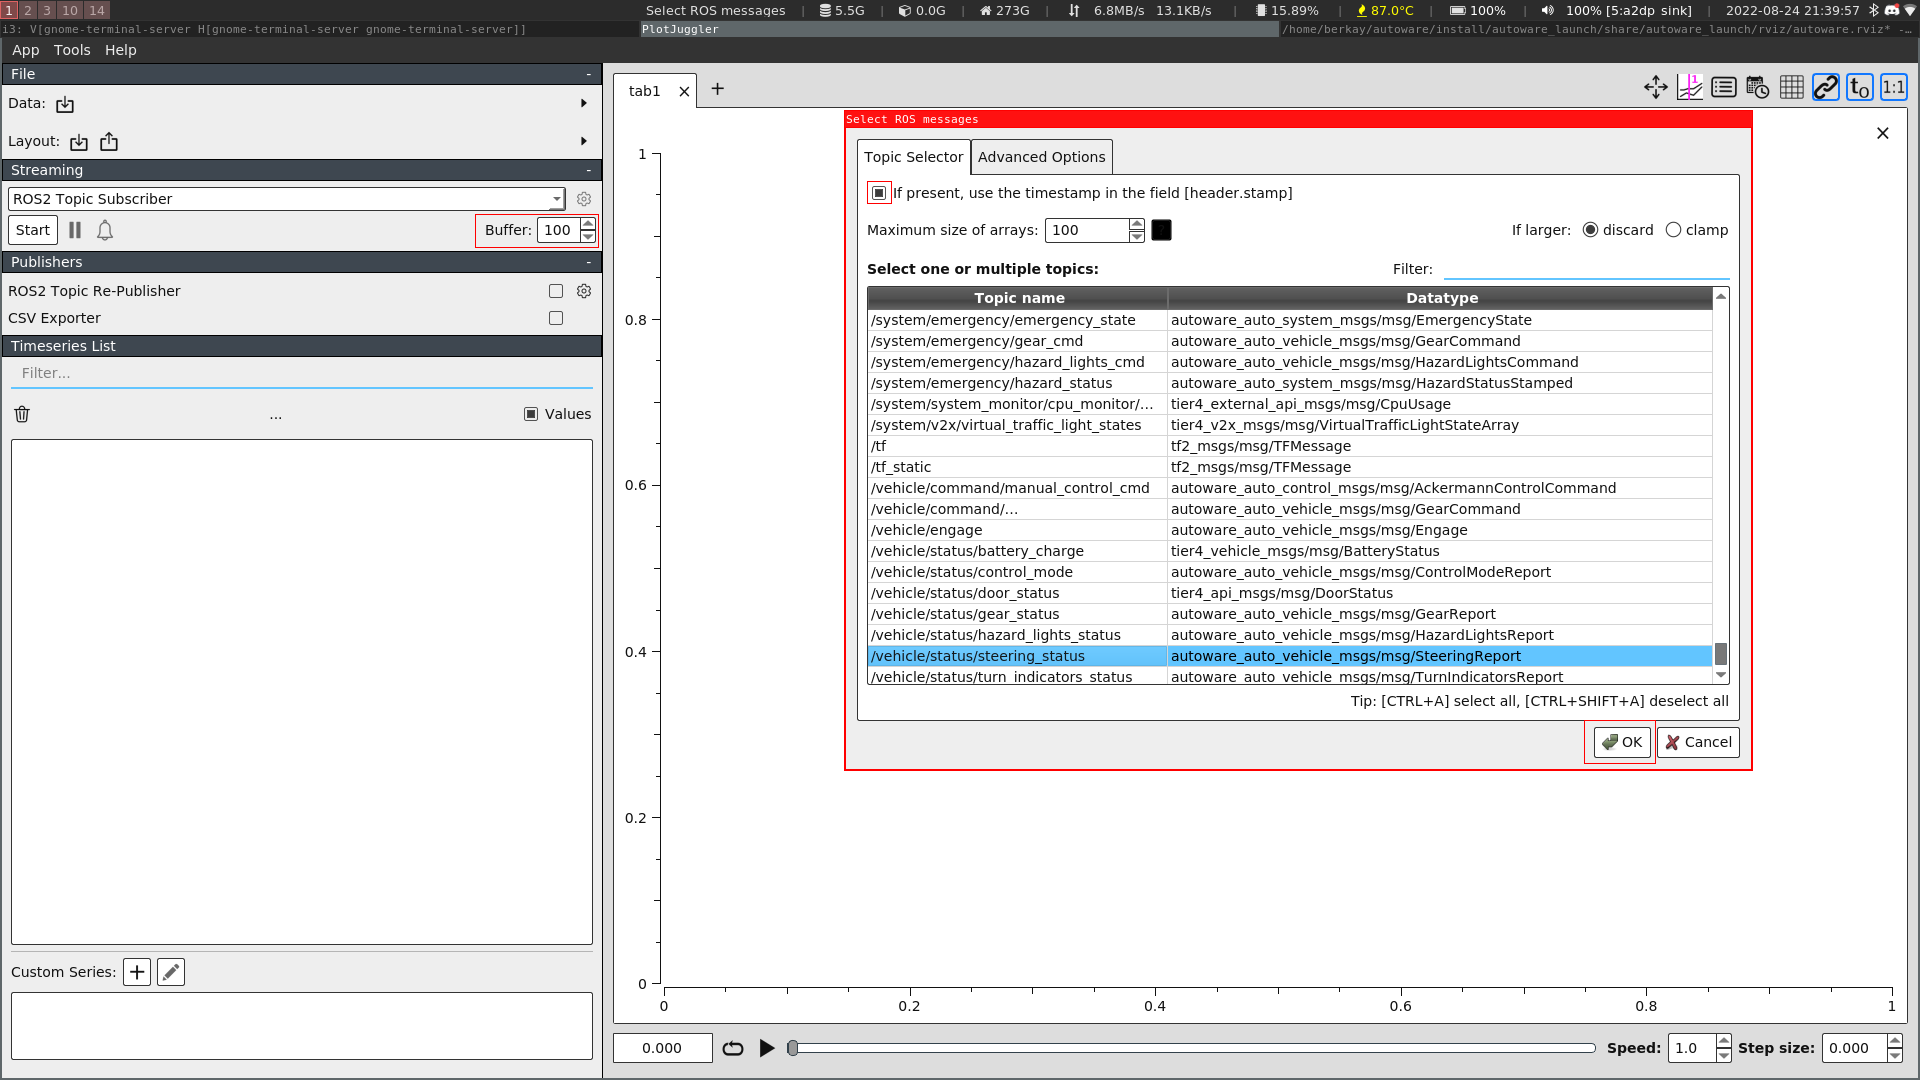
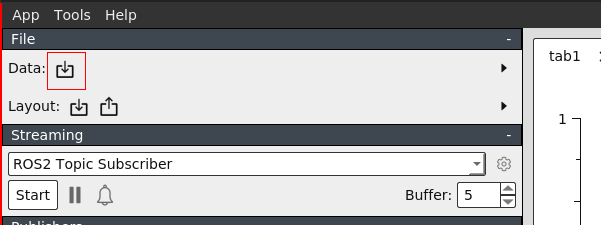
5. Increase the buffer size (maximum is 100), and import the layout from /autoware.universe/control/control_performance_analysis/config/controller_monitor.xml#
- After import the layout, please specify the topics that are listed below.
- /localization/kinematic_state
- /vehicle/status/steering_status
- /control_performance/driving_status
- /control_performance/performance_vars
- Please mark the
If present, use the timestamp in the field [header.stamp]box, then select the OK.
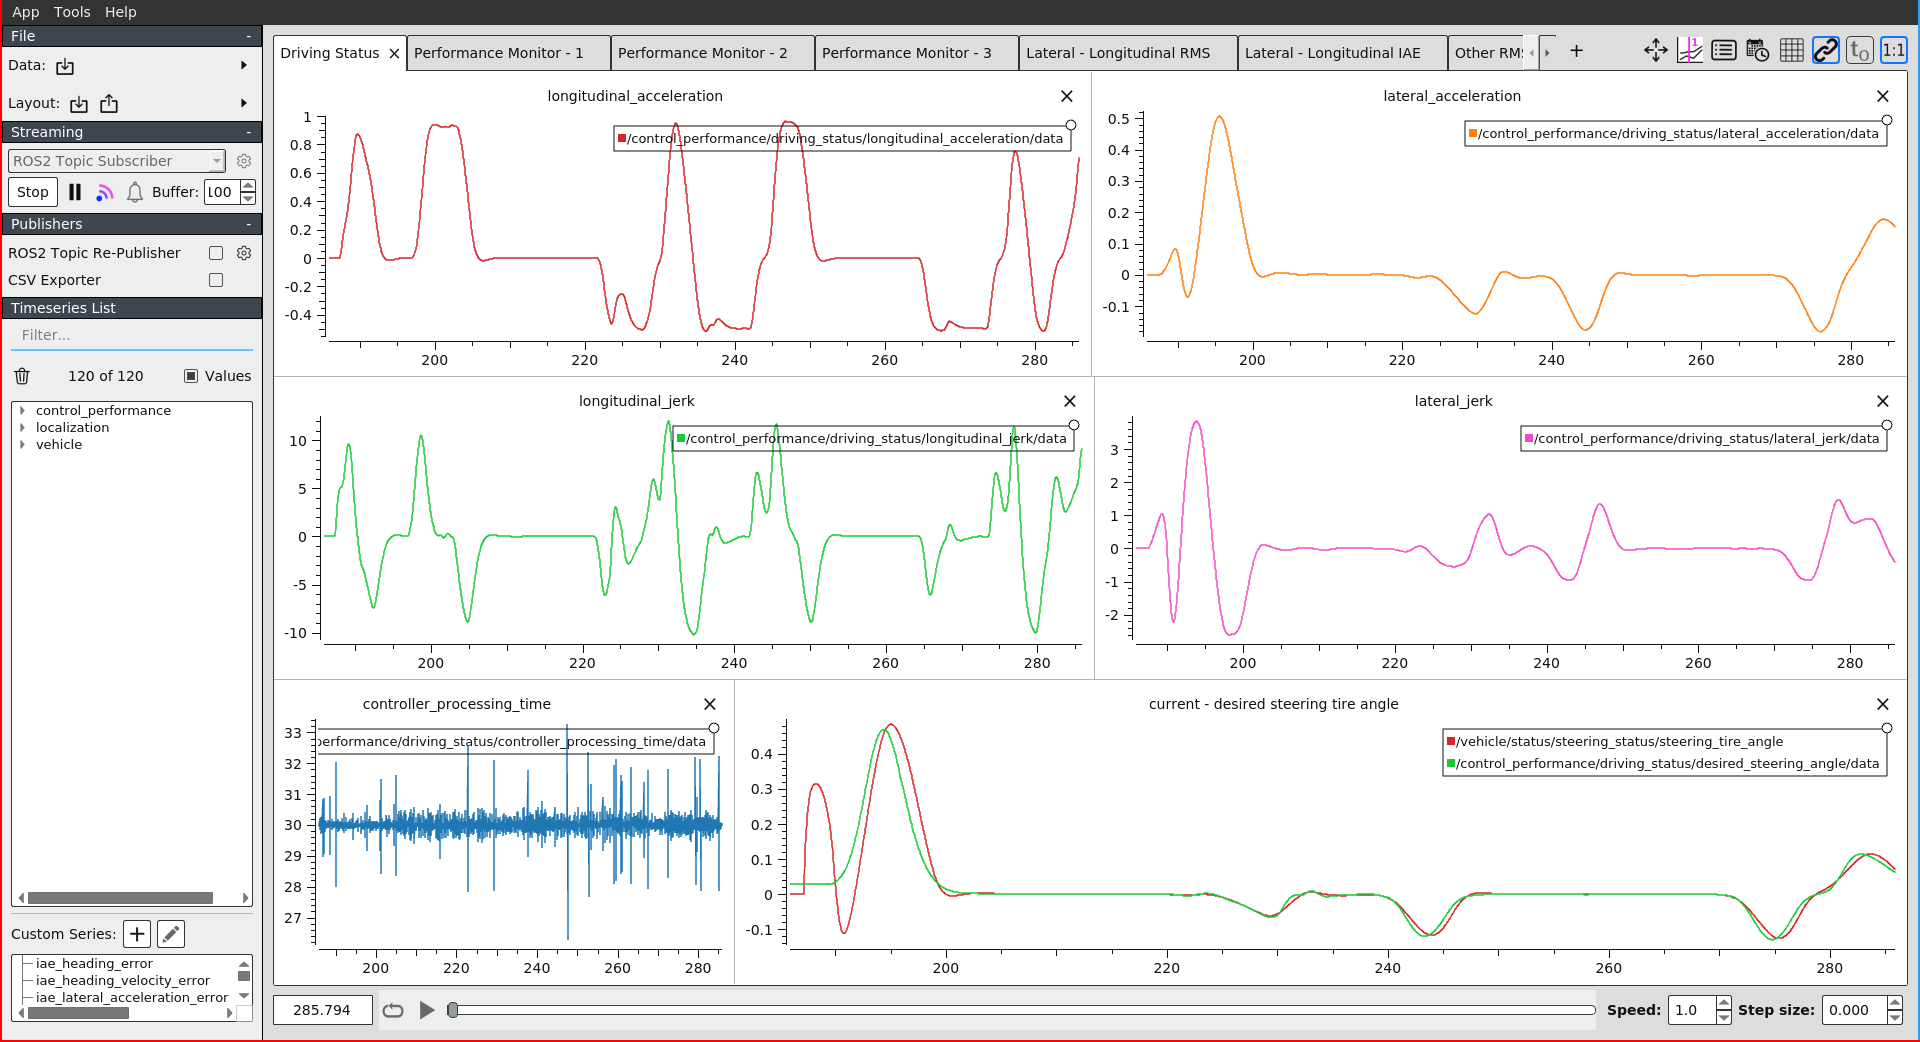
6. Now, you can start to driving. You should see all the performance and driving variables in PlotJuggler#
After Driving#
1. You can export the statistical output and all data to compare and later usage#
- With statistical data, you can export the all statistical values like (min, max, average) to compare the controllers.
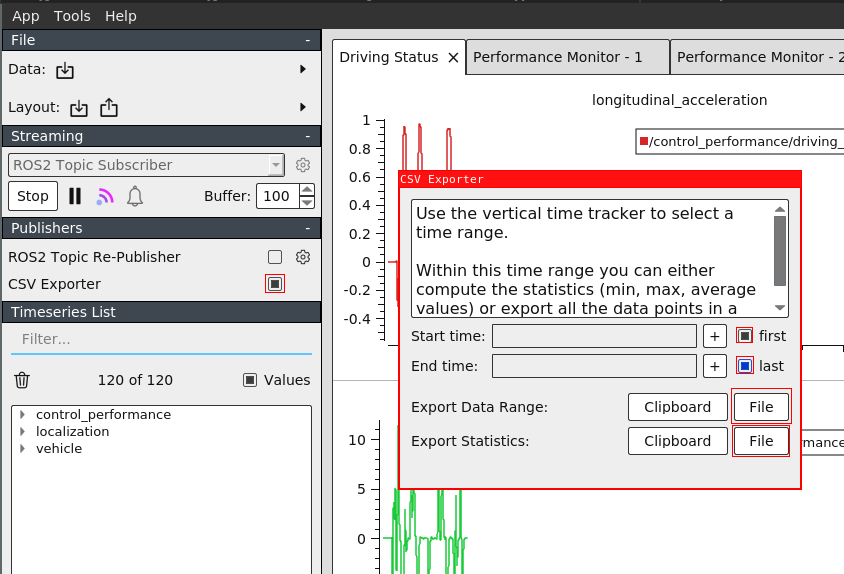
- You can also export all data to later use. To investigate them again, after launch PlotJuggler, import the
.cvsfile from data section.
Tips#
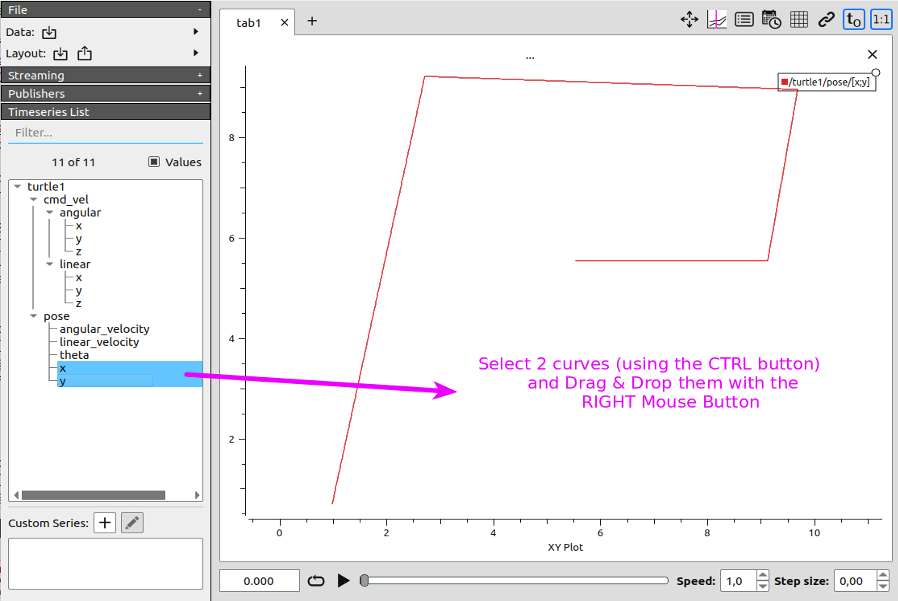
- You can plot the vehicle position. Select the two curve (keeping CTRL key pressed) and Drag & Drop them using the RIGHT Mouse button. Please visit the
Help -> Cheatsheetin PlotJuggler to see more tips about it.
- If you see too much noised curve in plots, you can adjust the
odom_intervalandlow_pass_filter_gainfrom here to avoid noised data.